Statistical Analysis

Challenges
If you need to get insight and draw knowledge by analysing your customer data, crunching sales numbers, monitoring supply chain operations or trying to detect fraud and need to apply powerful statistical analysis to all your data to get the most accurate answers. Our statistical solution can help with these problems.
Our Solution
- Using the best and quality-tested algorithms using latest statistical methodologies our solution guarantees a consistent reliable answer to all your business questions so you can analyse the past, describe the present and predict the future.
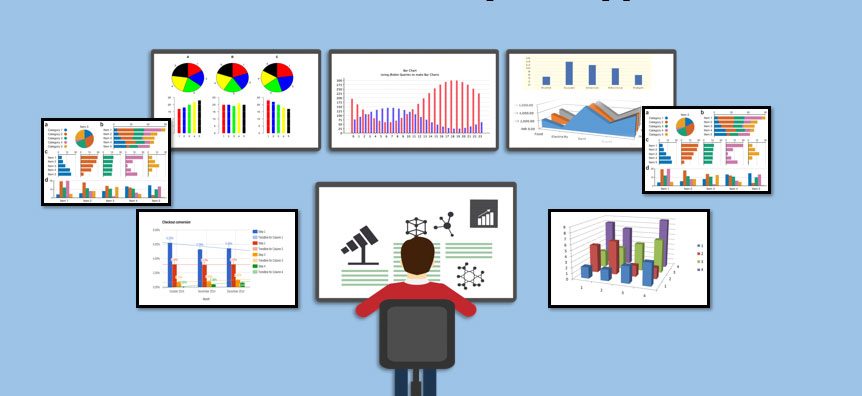
- Provides the flexibility to customize and generate task-specific graphics for more effective interpretation and communication of results. Simple to develop analytical-style graphs, maps, and charts with any style of output so you can deliver analytic results where they can be used the most.
- Allows for diverse areas within one environment with no need for multiple software applications. Our statistical analysis solution covers all analysis of variance, regression, categorical data analysis, multivariate analysis, survival analysis, psychometric analysis, cluster analysis, nonparametric analysis, mixed-models analysis, survey data analysis and much more.
Solution description
Our statistical analysis ensures quality control by enabling you to maintain consistent standards and use all information collected to make better decisions. It can handle big data from multiple processes and monitor multiple processes and integrate a wide variety of data to get a complete picture of your quality improvement environment. The solution operates on virtually any data source and runs across most computing platforms.
Spotting data quality issues is not enough without find out the root cause so to apply a permanent fix. Our solution provides advanced sophisticated quality improvement tools that creates more advanced statistical analyses so you can create more efficient, cost-effective processes and improve products.
This solution creates dashboards with graphical and statistical tools in helping reliability engineers and industrial statisticians working with live data and system repair data. These tools also benefit workers in other fields, such as medical research, pharmaceuticals, social science and business, where survival and recurrence data is analysed.
Technology description
It includes exact statistical techniques for small datasets, high-performance statistical modeling tools for large data tasks and modern methods for analysing data with missing values. And because the software is updated regularly, you’ll benefit from using the newest methods in the rapidly expanding field of statistics.
The solution has hundreds of built-in, customisable charts and graphs to ensure clear, consistent statistical output, so your analysis results are easy to understand. And because metadata is stored in a centralised repository, it’s easy to incorporate models into other solutions.

